Add Tree Map charts to your JavaScript apps.
Features
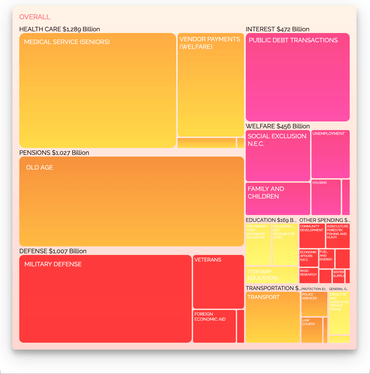
Vizuly Tree Map visualizes hierarchical data in nested rectangular plots where the area of each rectangle is bound to a data property you can set. This TreeMap also supports the ability to drill down/up, in addition to a navigation “bread-crumb” at the top of the visualization. In addition to several different fill/stroke styles you can adjust the padding between and within elements and provide header titles to each section.
Features
- Supports Drill Down/Up
- Interactive Navigation Header
- 6 example themes
- More than a dozen dynamic styles
- Dozens of adjustable properties and interactive event support
- Customizable Data Tips
- Documentation
Framework Adapters
- React Adapters
- Angular Adapters
- Vue.js Adapters