Add Scatter Plot charts to your JavaScript apps.
Features
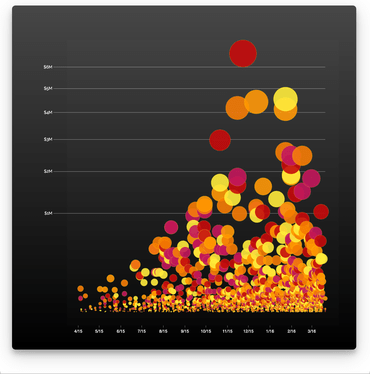
Vizuly Scatter Plot shows 3 dimensions of data at once by plotting values along both the x and y axis as well as the radius of the plot itself. Each plot can be colored and styled dynamically based on your data.
Features
- Supports Dynamic Scales for Radius and Plots
- 5 example themes
- More than a dozen dynamic styles
- Dozens of adjustable properties and interactive event support
- Customizable Data Tips
- Documentation
Framework Adapters
- React Adapters
- Angular Adapters
- Vue.js Adapters