High-performance data grid and high-volume data charts.
Features
Lightweight React Data Grid - The lightweight React Data Grid was built to meet the challenge of displaying large amounts of data while providing superior versatility and performance on mobile devices. The virtualization engine provides a foundation on which the core line-of-business features rest. Features include:
- DataSource
- Sorting and Filtering
- Built-in Columns
- Column Grouping with Sticky Headers
- Responsive Layout
- Animation
- Live Scrolling
- Selection
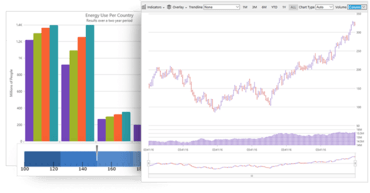
Real-Time and High-Volume Data Charts - Build expressive dashboards, apply deep analytics, and render millions of data points with real-time React charts. Including financial and category charts. Your charts shouldn’t just be fast; they should be all-encompassing. With every common category chart type - bar, line, column, pie, area, and more - you can visualize your data the way you prefer. Features include:
- Axis Labels
- Axis Titles
- Axis Tickmarks
- Axis Ranges
- Axis Interval
- Axis Scales
- Series Animations
- Data Binding
- Custom Overlays
- Financial Indicators
- Trendlines
- Built-in Markers
- Custom Tooltips
- WAI-ARIA Support
Gauges
- Bullet Graph - The Bullet Graph Component allows for a linear and concise view of measures compared against a scale.
- Linear Gauge - Use the Linear Gauge component to see a simple display of a value compared against a scale and one or more ranges.
- Radial Gauge - The Radial Gauge component provides a number of visual elements, like a needle, tick marks, ranges, and labels, in order to create a predefined shape and scale.