Adds new Group Stacked Bar chart (MSStackedBar2D) and updates support for Angular and React.
Features
- FusionCharts 3.19
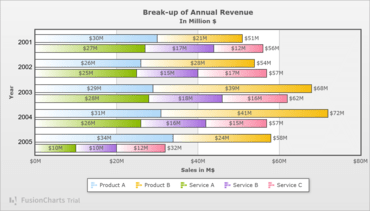
- Added a new Group Stacked Bar chart called the MSStackedBar2D chart which helps users represent data values as a sum of two or more values.
- Added the ability to show the percentage value with the corresponding legend in Doughnut and Pie charts.
- Updated Angular integration to support Angular versions 11, 12, and 13.
- Updated React integration to support React versions 16, 17, and 18.
- Improved PDF encoding allowing users to save and export PDF files on a local server. Previously, saving a PDF resulted in a corrupted file.
- The FusionMap feature now shows the Indian region of Ladakh as a separate entity.
- Added the ability for users to define the legend container's width.
- Improved the readability of Multiseries charts by preventing plotted value series from overlapping when using the same or similar values.
- FusionTime 2.7
- Improved chart visualization by allowing users to use the new paletteColor feature to specify a custom color for an individual series at plot level in a column visualization.